| Retail | VANGUARD CONVERTIBLE SECURITIES FUND | |||||||||||||||||||||||||||||||||||||
| Fund Summary | |||||||||||||||||||||||||||||||||||||
| Investment Objective | |||||||||||||||||||||||||||||||||||||
| The Fund seeks to provide current income and long-term capital appreciation. | |||||||||||||||||||||||||||||||||||||
| Fees and Expenses | |||||||||||||||||||||||||||||||||||||
| The following table describes the fees and expenses you may pay if you buy and hold shares of the Fund. | |||||||||||||||||||||||||||||||||||||
| Shareholder Fees (Fees paid directly from your investment) | |||||||||||||||||||||||||||||||||||||
| |||||||||||||||||||||||||||||||||||||
| Annual Fund Operating Expenses (Expenses that you pay each year as a percentage of the value of your investment) | |||||||||||||||||||||||||||||||||||||
| |||||||||||||||||||||||||||||||||||||
| Example | |||||||||||||||||||||||||||||||||||||
| The following example is intended to help you compare the cost of investing in the Fund with the cost of investing in other mutual funds. It illustrates the hypothetical expenses that you would incur over various periods if you were to invest $10,000 in the Fund’s shares. This example assumes that the Fund provides a return of 5% each year and that total annual fund operating expenses remain as stated in the preceding table. You would incur these hypothetical expenses whether or not you redeem your investment at the end of the given period. Although your actual costs may be higher or lower, based on these assumptions your costs would be: | |||||||||||||||||||||||||||||||||||||
| |||||||||||||||||||||||||||||||||||||
| Portfolio Turnover | |||||||||||||||||||||||||||||||||||||
| The Fund pays transaction costs, such as commissions, when it buys and sells securities (or “turns over” its portfolio). A higher portfolio turnover rate may indicate higher transaction costs and may result in more taxes when Fund shares are held in a taxable account. These costs, which are not reflected in annual fund operating expenses or in the previous expense example, reduce the Fund’s performance. During the most recent fiscal year, the Fund’s portfolio turnover rate was 130% of the average value of its portfolio. | |||||||||||||||||||||||||||||||||||||
| Principal Investment Strategies | |||||||||||||||||||||||||||||||||||||
| Under normal circumstances, the Fund invests at least 80% of its assets in U.S. and foreign convertible securities, which are hybrid securities that combine the investment characteristics of bonds and common stocks. Convertible securities include corporate bonds and preferred stocks that are convertible into common stock, as well as fixed income securities with warrants or common stock attached. Many convertible securities have credit ratings that are either below investment-grade or may not be rated. | |||||||||||||||||||||||||||||||||||||
| Principal Risks | |||||||||||||||||||||||||||||||||||||
| An investment in the Fund could lose money over short or long periods of time. You should expect the Fund’s share price and total return to fluctuate within a wide range. The Fund is subject to the following risks, which could affect the Fund’s performance: • Stock market risk, which is the chance that stock prices overall will decline, causing the prices of convertible securities to decline. Stock markets tend to move in cycles, with periods of rising prices and periods of falling prices. The Fund’s investments in securities that are convertible into foreign stocks may perform differently from their U.S. counterparts. • Credit risk, which is the chance that the issuer of a convertible security will fail to pay interest, dividends, or principal in a timely manner or that negative perceptions of the issuer’s ability to make such payments will cause the price of that security to decline. Companies that issue convertible securities are often small to mid-size, and they often have credit ratings below investment-grade or they may not be rated. In addition, the credit rating of a company’s convertible securities is generally lower than that of its nonconvertible debt securities. This is because convertible securities are normally considered ”junior“ securities—that is, the issuer usually must make required interest and principal payments on its nonconvertible debt before it can make payments on its convertible securities. If an issuer stops making interest or principal payments, these securities may become worthless and the Fund could lose its entire investment. Reflecting the universe of convertible securities, most of the Fund’s rated holdings are below investment-grade (commonly referred to as “junk bonds”), and some may be unrated. Therefore, credit risk is greater for the Fund than for funds that invest in higher-grade securities. • Interest rate risk, which is the chance that prices of convertible securities will decline along with overall bond prices because of rising interest rates. Convertible securities are more sensitive to interest rate changes when their predetermined conversion price is much higher than the price of the issuing company’s common stock, and are less sensitive to interest rate changes as the price of the issuing company’s stock approaches the predetermined conversion price. • Manager risk, which is the chance that poor security selection will cause the Fund to underperform relevant benchmarks or other funds with a similar investment objective. In addition, significant investment in the information technology sector subjects the Fund to proportionately higher exposure to the risks of this sector. • Liquidity risk, which is the chance that the Fund may not be able to sell a security in a timely manner at a desired price. • Country risk, which is the chance that world events—such as political upheaval, financial troubles, or natural disasters—will adversely affect the value and/or liquidity of securities issued by companies in foreign countries. • Currency hedging risk, which is the chance that the currency hedging transactions entered into by the Fund may not perfectly offset the Fund’s foreign currency exposure. For example, the Fund will decline in value if it underhedges a currency that has weakened or overhedges a currency that has strengthened relative to the U.S. dollar. • Derivatives risk. The Fund may invest in derivatives, which may involve risks different from, and possibly greater than, those of investments directly in the underlying securities or assets. An investment in the Fund is not a deposit of a bank and is not insured or guaranteed by the Federal Deposit Insurance Corporation or any other government agency. | |||||||||||||||||||||||||||||||||||||
| Annual Total Returns | |||||||||||||||||||||||||||||||||||||
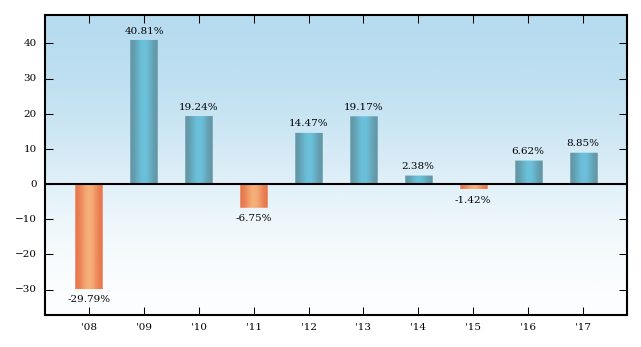
| The following bar chart and table are intended to help you understand the risks of investing in the Fund. The bar chart shows how the performance of the Fund has varied from one calendar year to another over the periods shown. The table shows how the average annual total returns of the Fund compare with those of a relevant market index and other comparative benchmarks, which have investment characteristics similar to those of the Fund. Returns for the Convertible Securities Funds Average are derived from data provided by Lipper, a Thomson Reuters Company. Keep in mind that the Fund’s past performance (before and after taxes) does not indicate how the Fund will perform in the future. Updated performance information is available on our website at vanguard.com/performance or by calling Vanguard toll-free at 800-662-7447. | |||||||||||||||||||||||||||||||||||||
| Annual Total Returns — Vanguard Convertible Securities Fund Investor Shares | |||||||||||||||||||||||||||||||||||||
| |||||||||||||||||||||||||||||||||||||
| During the periods shown in the bar chart, the highest return for a calendar quarter was 14.66% (quarter ended September 30, 2009), and the lowest return for a quarter was –15.90% (quarter ended December 31, 2008). | |||||||||||||||||||||||||||||||||||||
| Average Annual Total Returns for Periods Ended December 31, 2017 | |||||||||||||||||||||||||||||||||||||
| |||||||||||||||||||||||||||||||||||||
| Actual after-tax returns depend on your tax situation and may differ from those shown in the preceding table. When after-tax returns are calculated, it is assumed that the shareholder was in the highest individual federal marginal income tax bracket at the time of each distribution of income or capital gains or upon redemption. State and local income taxes are not reflected in the calculations. Please note that after-tax returns are not relevant for a shareholder who holds fund shares in a tax-deferred account, such as an individual retirement account or a 401(k) plan. Also, figures captioned Return After Taxes on Distributions and Sale of Fund Shares may be higher than other figures for the same period if a capital loss occurs upon redemption and results in an assumed tax deduction for the shareholder. | |||||||||||||||||||||||||||||||||||||